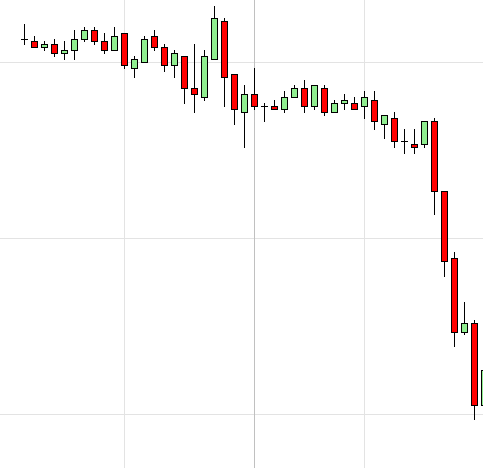
 The Candle is the basis for every chart that is analyzed and traded on. It is a graphic representation of what is happening in the market at any given time. Multiple candles grouped together are called Price Action. This section will go over the basics of how to read a candle chart. Readers will be able to analyze events that happened in the past and speculate future events based on price action.
Candle Basics
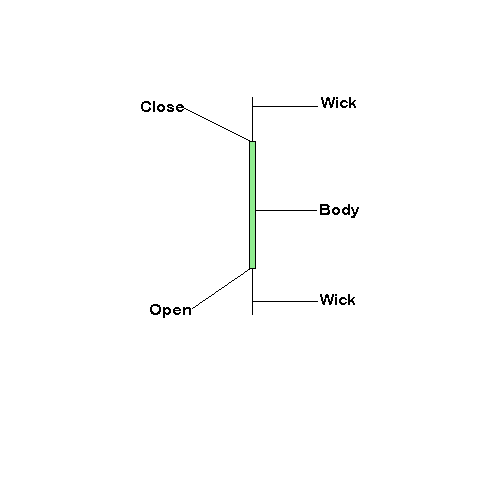
A candle consists of four parts
- Open-is where price is initially for that candle
- Close– is where price ends for that candle
- Body-represents the path from open to close
- Wick– represents where price extended beyond but rejected
Bullish Candle
A bullish candle is represented by the color green. It is a representation that price moved in the upward direction.
Bearish Candle
A bearish candle is represented by the color red. It is a representation that price moved in a downward direction.


